K3s Production Without Centralized Logs: Metrics, Privacy and Trade-Offs
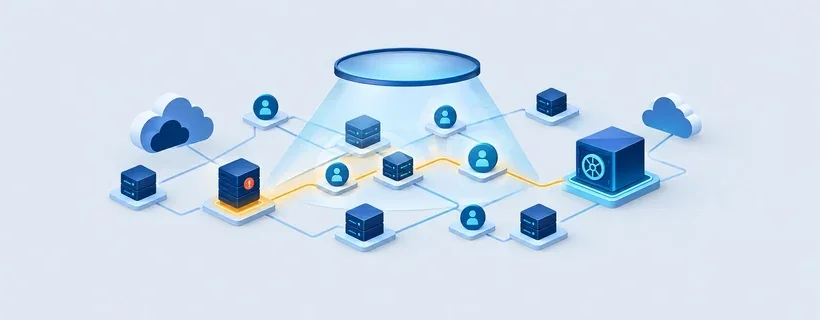
A Kubernetes platform can stay observable without building a central archive of application logs. One production deployment running more than 15 microservices on K3s uses Prometheus metrics for routine monitoring, then enables temporary, service-level logging when an incident calls for deeper inspection. The design’s central choice is to avoid collecting user information through centralized logging in the first place.
That approach changes the usual privacy equation. Retention policies govern data after collection; this platform’s design constraint limits what enters its observability systems at all. My read is that this is practical for teams whose incident and capacity questions can be answered through carefully chosen metrics, but it demands deliberate instrumentation and accepts gaps in retrospective investigation.
A distributed K3s platform with a firm boundary
The environment spans virtual private servers in multiple locations. More than 15 microservices run across the K3s cluster, and the nodes communicate over a private WireGuard network. Ansible provisions new nodes from bare VPS instances, bringing them into the cluster in minutes without manual steps.
The infrastructure is conventional enough; the unusual decision is what it doesn’t do. There is no centralized pipeline collecting, forwarding or archiving application logs. The operator set that boundary during the platform’s design, framing observability as something that must not become a channel for gathering information about users.
That distinction matters because deletion controls depend on collection happening first. A system that gathers logs and later applies retention periods, access rules or deletion requests has to keep those processes correct as teams and configurations change. This design avoids relying on those controls for application data that never reaches a central log store.
It also reduces one specific exposure: user information can’t leak from a centralized logging system if that system never receives it. That doesn’t mean the platform has no operational data or that sensitive information is impossible to expose elsewhere. It means the logging architecture itself is constrained from the outset.
Prometheus allowlists shape what gets stored
Routine observability relies on technical metrics such as load, latency, queue depth and error rates. Prometheus applies an allowlist to application labels during ingestion, removing labels outside the approved set before the samples enter metric storage. The configuration retains only these names:
metric_relabel_configs:
  - action: labelkeep
    regex: __name__|job|instance|service|route|method|code|le|quantile
The __name__ entry is necessary because Prometheus represents the metric name as a label at this relabeling stage. Dropping it would leave the samples without a valid metric name.
Infrastructure metrics have a different allowance: labels such as namespaces and pod names remain available, while user data does not. Application metrics use the shorter list so the stored series can still identify a service, route, method, response code or histogram bucket without preserving arbitrary label values.
There’s a key limit to this control. Prometheus relabeling runs after a scrape, so disallowed labels may reach Prometheus before the filter removes them from stored samples. The instrumentation itself must therefore avoid exposing sensitive user information in metrics.
The allowlist also checks label names, not their contents. A route label could still contain a raw URL with a user identifier. Code review provides a second guardrail: routes must use templates such as /users/:id, rather than recording a concrete path. That rule puts responsibility on application teams to keep metric values bounded and non-identifying.
Incident response starts with symptoms
Alerts are built from the same metric series used for monitoring. They track user-visible conditions such as elevated route latency or queues whose work has stopped progressing. Because the alerting model is based on service behavior, it doesn’t depend on searching historical log lines.
When an incident starts, high-resolution metrics help narrow the investigation to a particular service and behavior, often within minutes. That’s the payoff of designing metrics around operational questions from the beginning: teams can see changes in latency, errors or queue depth without first sifting through a large volume of unrelated logs.
Metrics still have a blind spot. They can show that a service is failing and when its behavior changed, but they can’t answer every question about an unanticipated code path. If the available series aren’t enough, the operator temporarily raises the affected deployment’s LOG_LEVEL, reproduces the issue and follows output with kubectl logs -f. Once the cause is identified, the setting is rolled back.
This is a controlled diagnostic window, not a claim that log lines never exist. Container standard output remains available locally through the container runtime and Kubernetes, subject to each node’s rotation and cleanup behavior. Rolling back a deployment does not by itself guarantee immediate removal of every local log file. The nodes also use volatile storage for journald.
The distinction is operationally important: the platform has no central mechanism that gathers and retains application logs, but local output can still be produced and inspected. Temporary verbosity must be handled with care because leaving it enabled could accumulate information the architecture is meant to avoid storing.
Reviewing the path from VPS to telemetry
An external engineer examined the system to check whether its real behavior matched the design. The review followed the node lifecycle from a bare VPS to cluster membership, inspected traffic across the WireGuard network and checked traffic leaving the nodes.
The reviewer was asked to look for gaps between the intended architecture and the deployed one, including places where incident visibility might be weaker than expected. The observed telemetry matched the Prometheus scrape configuration: metric series carried the permitted labels, and there was no separate centralized log-forwarding pipeline.
That kind of inspection matters because a configuration file alone can’t establish where data travels across a distributed platform. Here, tracing node and network behavior provided evidence that the logging boundary was present in the running system, not only in the design description.
What the model gives up
Without a log archive, teams can’t go back later and search for events they didn’t think to instrument. Metrics require advance decisions about which behaviors matter and which dimensions engineers will need during an incident. When an unknown failure occurs, that preparation may not capture the details a log search could have revealed.
The model also doesn’t meet every operational need. Organizations that must produce an immutable audit trail need a dedicated audit pipeline; this architecture isn’t designed to provide one. It trades broad retrospective detail for a narrower collection surface, so its fit depends on the questions the organization must answer.
Teams adopting this pattern need clear ownership of metric design, route-label conventions and temporary diagnostic logging. The ability to change a declarative setting with one line makes verbose logging easy to enable, but the same convenience makes a rollback process essential. The discipline has to cover the full lifecycle: turn diagnostics on for a specific purpose, inspect the output, then restore the normal setting.
Observability by design
The platform demonstrates a workable option for teams that can cover routine production monitoring with metrics and accept temporary, local diagnostics for less common cases. High-resolution metrics storage and private networking tools such as WireGuard help make that architecture practical, while the most important control remains the data boundary established in application instrumentation and Prometheus configuration.
For teams focused on data minimization, the useful question is not simply how long logs should be retained. It’s which operational needs require centralized logs at all, and whether metrics can answer those questions with less user data in circulation. This design suggests that visibility and privacy can coexist when the telemetry schema is treated as an architectural decision, and when its limits are explicit to the people responding to incidents.