Kubernetes v1.36 Elevates Resource Monitoring with PSI Metrics Going GA
Launched in Kubernetes v1.36, Pressure Stall Information (PSI) metrics are now generally available, offering a powerful tool for monitoring resource contention across nodes, pods, and containers. Originally implemented in the Linux kernel back in 2018, PSI stands out by providing actionable insights about resource saturation before it escalates into outages. Unlike traditional metrics that might merely indicate utilization, PSI quantifies the time tasks spend stalled, delivering percentages that can significantly enhance operational awareness.
Why PSI Metrics Matter
Relying solely on CPU or memory utilization can present an incomplete picture of system health. A node may show healthy CPU utilization figures, yet internal delays could still hinder application performance. This is where PSI metrics come into play. They deliver:
- Cumulative Totals: Absolute time spent in stalled states, enabling clearer diagnosis of resource issues.
- Moving Averages: Historical averages over different time windows (10s, 60s, 300s) help distinguish between temporary surges and persistent resource pressures.
Performance Testing: Ensuring Stability
One critical aspect of deploying new telemetry features is ensuring that they don't impose unacceptable overhead on system performance. The Kubernetes SIG Node undertook rigorous production-scale performance testing, simulating high-density workloads (80+ pods) across varied machine configurations to thoroughly vet the feature’s viability.
The tests concentrated on two scenarios to pinpoint Kubelet and kernel-level impacts:
- Scenario A: Kubelet's effect when PSI is enabled and tested against a baseline with kernel-level PSI tracking but without Kubelet integration.
- Scenario B: The kernel’s overhead when PSI is either enabled or disabled, with the Kubelet active.
Analysis of Kubelet Overhead
In our initial scenario, we examined Kubelet behavior on a four-core machine. The kernel tracks pressure efficiently, obtaining accurate data with minimal impact from Kubelet querying. In fact, the results revealed that Kubelet’s query logic incurs an insignificantly low overhead—only about 0.1 cores (around 2.5% of total node capacity). This established that Kubelet’s handling of PSI metrics can coexist comfortably with other operational demands.
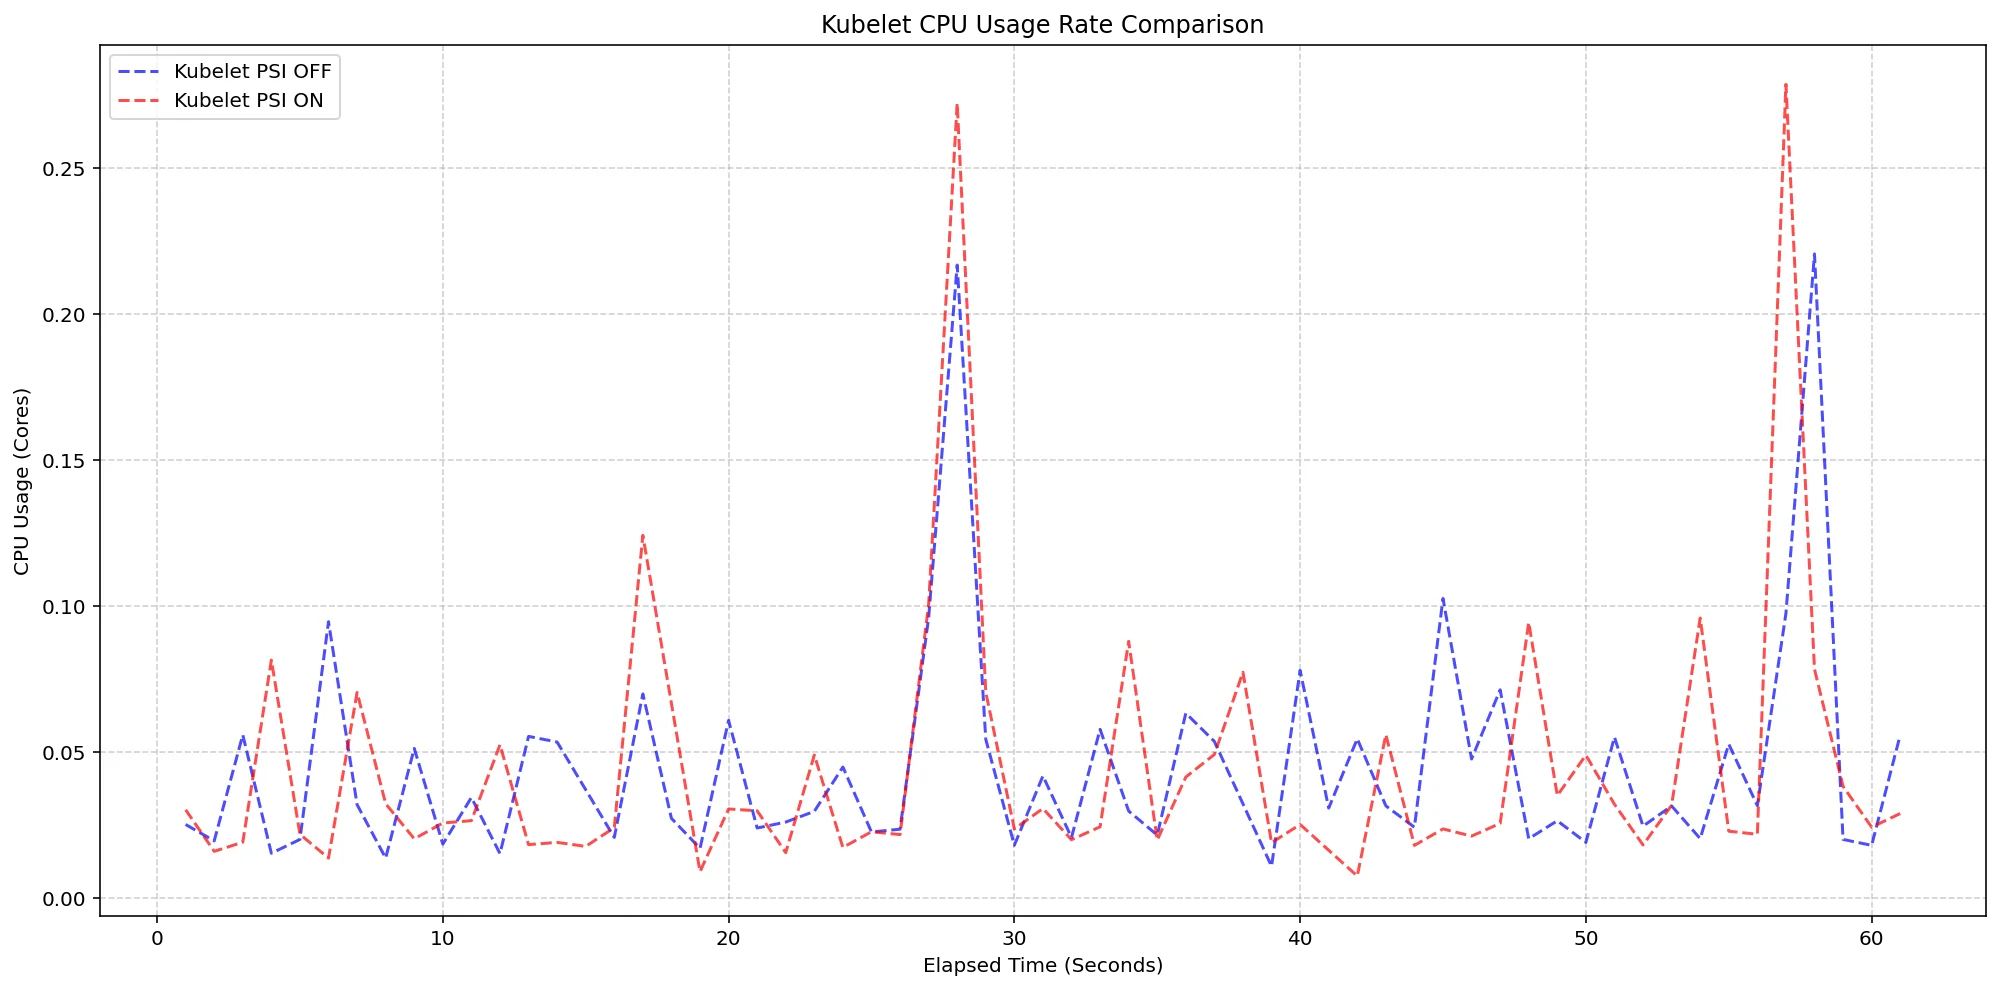
(Case A) Kubelet CPU Usage Rate Comparison
Figure 1: Analyzing Kubelet CPU usage illustrates minimal resource consumption while collecting PSI data.
Next, we measured total system CPU usage during these tests. Performance remained consistent across configurations, demonstrating that even with PSI metrics enabled, the Kubelet’s impact on system performance was minimal, remaining well within operational limits.
Analyzing Kernel Overhead
The next phase shifted focus to the impact of enabling PSI on the Linux kernel. We validated kernel performance by comparing clusters set with PSI enabled versus those without. Despite the pressure of substantial workloads, the overhead recorded was negligible, establishing robust tracking efficiency while allowing the system to maintain nearly full productivity.
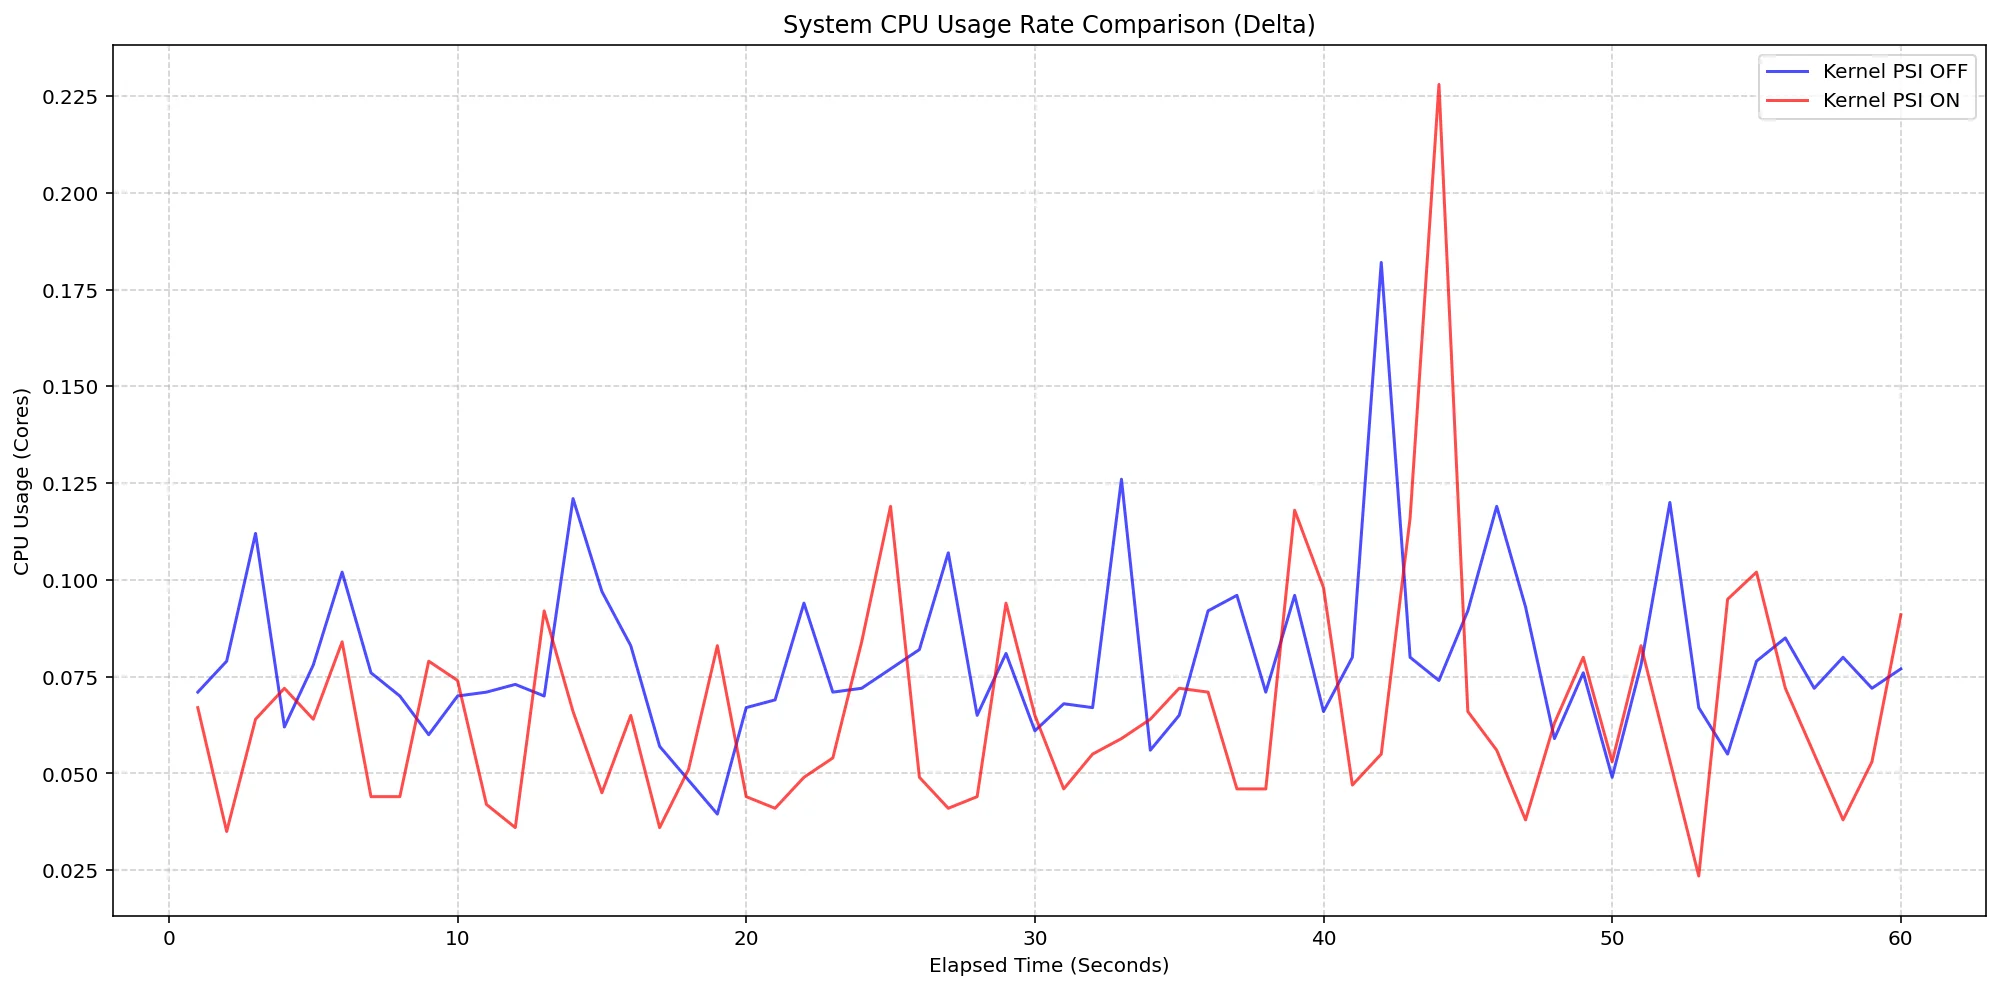
(Case B) Node System CPU Usage Rate Comparison
Figure 2: Kernel CPU overhead remained low, solidifying PSI's efficiency during heavy loads.
Key Improvements from Beta to Stable Versions
The transition from beta versions (1.34) to the stable release (1.36) comes with significant improvements in how Kubernetes handles PSI metrics. One major change is how the Kubelet emits metrics based on OS support. Previously, if the underlying kernel lacked PSI support, Kubelet could mistakenly emit zero-valued metrics. In version 1.36, the Kubelet checks for valid PSI support before reporting, ensuring that only accurate metrics are presented. This adjustment helps mitigate the risk of false alarms and provides cleaner data for system monitoring.
Enabling and Using PSI Metrics
To leverage PSI metrics within your Kubernetes environment, specific prerequisites must be met:
- Ensure your nodes are on a Linux kernel version of 4.20 or later, utilizing cgroup v2.
- Verify that PSI is enabled at your OS level (confirm kernel configuration with
CONFIG_PSI=ywithout thepsi=0boot parameter).
Upon fulfilling these requirements, the Kubelet PSI metrics are available for immediate use in production, allowing administrators to scrape data from the /metrics/cadvisor endpoint via Prometheus or query the Summary API for advanced visualization.
Note: Accessing the Kubelet API requires administrative privileges. Ensure proper permissions are granted before executing these commands to avoid security risks.
CONTAINER_NAME="your-container-name"
kubectl get --raw "/api/v1/nodes/$(kubectl get nodes -o jsonpath='{.items[0].metadata.name}')/proxy/stats/summary" | jq '.pods[].containers[] | select(.name=="'"$CONTAINER_NAME"'") | {name, cpu: .cpu.psi, memory: .memory.psi, io: .io.psi}'
Additional Resources for Deep Dives
For those interested in more detailed insights regarding PSI metrics and their impact, consider reviewing the following resources:
Acknowledgments and Community Engagement
The rollout of PSI metrics is a testament to the collaborative efforts of the Kubernetes SIG Node community, comprising those who designed, implemented, tested, and documented this functionality from alpha to GA. Feedback from users is vital for continual improvement, and interested parties are encouraged to engage through Slack, contribute to discussions, or report issues on GitHub.
By participating, you help shape the future of PSI metrics in Kubernetes and ensure that resource monitoring tools continue to evolve effectively.