Evaluating Machine Learning Predictions for the 2026 FIFA World Cup Group Stage
After the conclusion of the group stage at the 2026 FIFA World Cup, a recent evaluation of probabilistic forecasts reveals insights into where machine learning predictions excelled and where they missed the mark.
Adapting to a New Format
With a total of 72 matches crammed into just over two weeks, the group stage showcased an expanded format featuring 48 teams. This change not only challenged spectators but also posed difficulties for the machine learning algorithm developed to predict match outcomes. The foundational training data was based on earlier tournaments with only 32 teams, making the new dynamics particularly complex.
The increase in the number of matches pitting widely-disparate teams against each other led to unexpected results. Moreover, with 8 out of the 12 third-ranked teams advancing to the knockout phase, the strategy shifted. Teams were often more focused on avoiding losses, resulting in an increase in draws, which challenged the algorithm's predictive accuracy.
Key Takeaways
The tournament favorites all advanced to the Round of 32, while notably, several African teams, including South Africa, Cape Verde, and DR Congo, defied predictions by progressing. The algorithm provided accurate win/loss probabilities for the majority of matches but underestimated goal margins, particularly in contests involving mismatched teams.
Notably, the predicted goal differences were frequently lower than what transpired on the pitch. This discrepancy stems from the larger pool of weaker teams introduced in this tournament. This also correlated with a higher incidence of draws, as strategic gameplay emerged in crucial final group matches, exemplified by the Algeria and Austria encounter.
Performance of Predictions
Let’s examine the outcomes more closely. The accompanying barplots illustrate the predicted probabilities of each of the teams advancing to the Round of 32, colored to reflect actual results.
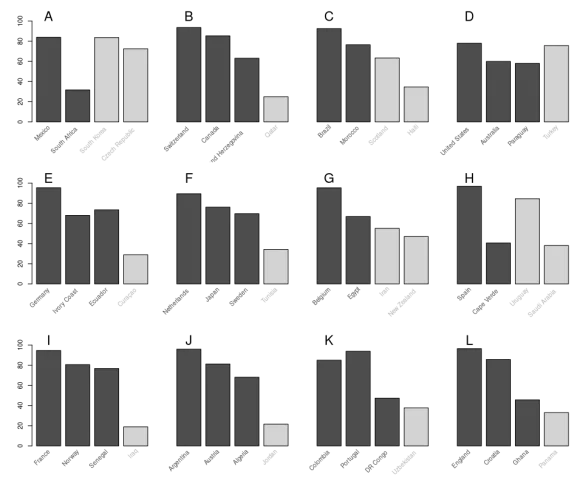
Once again, all favorites successfully advanced, while many with lower odds fell out. Among the surprises were the African teams that successfully reached the knockout rounds. Despite lukewarm performances during the group stage, leading teams like Spain, England, Germany, and Portugal managed to progress without serious penalties.
Analyzing Match Outcomes
The evaluation of individual matches further illuminates how well the algorithm's forecasts matched reality. A stacked bar plot groupings reveal the results based on predicted differences in goal outcomes.
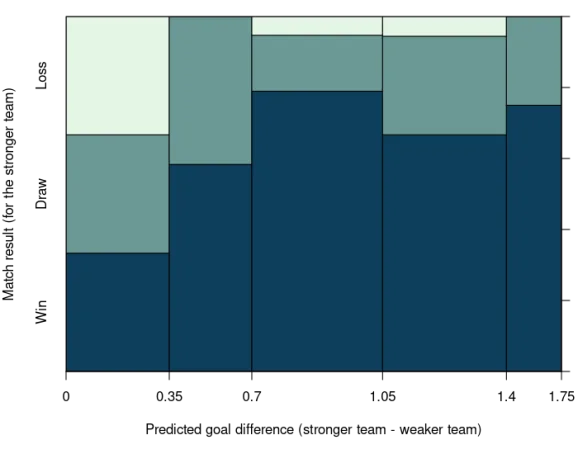
In matches where teams were evenly matched, our predictions held strong, with each outcome falling in line with expectations. However, as the anticipated superiority of one team over another increased, the match outcomes didn't align as closely with the algorithm's forecasts.
Specifically, in matches with a predicted goal difference greater than 1.05, the algorithm struggled; the expected outcome did not adjust adequately for instances where a clear favorite failed to deliver. This inconsistency hints at gaps in the algorithm's predictive modeling.
To probe deeper, let’s compare observed goal differences with expected distributions using hanging rootograms that illustrate the alignment of actual results against predictions made by the Poisson model employed.

In the left panel showing low predicted differences, outcomes aligned fairly closely with expectations, although draws surfaced with slight overrepresentation. In contrast, when examining matches with large predicted advantages, a significant bias emerged: low goal differences were understated while extreme outcomes were overrepresented. The algorithm did not fully account for the strategic behavior of teams aiming for draws as they conferred with the format of the tournament.
Looking Ahead: Predictions for Knockout Stage
Turning our gaze to the knockout stage, we assess how group stage outcomes reshaped predicted probabilities for advancing teams. These predictions are based on initial assumptions that previous results fall within expected random variations.
Simulating the knockout stage 100,000 times allows us to gauge shifts in winning probabilities.
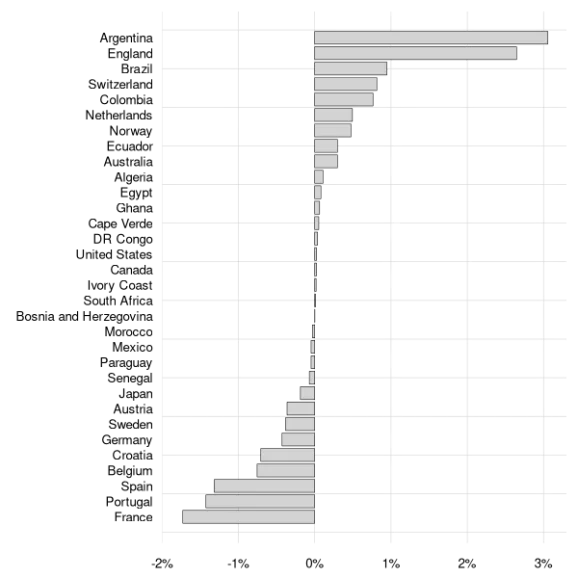
The findings indicate that Argentina and England stand to benefit the most from the current tournament layout, with both teams positioned in a less competitive bracket. Consequently, Argentina's winning chance rose from 8.2% to 11.3%, while England's increased from 12.4% to 15.0%. These figures reflect confident gameplay expectations moving forward.
Conversely, teams like Spain and France face greater challenges, with potential knockouts looming earlier than anticipated. Such matchups create formidable barriers en route to the finals.
As we move into the knockout rounds, the tournament promises high-stakes drama that will further test both team strategies and analytical forecasts. With 32 teams remaining—and Canada having recently secured victory over South Africa—the excitement is just beginning.
R-bloggers.com offers daily e-mail updates about R news and tutorials about learning R and many other topics. Click here if you're looking to post or find an R/data-science job.
Want to share your content on R-bloggers? click here if you have a blog, or here if you don't.